Amazon CloudWatch dashboards are customizable pages in the CloudWatch console that you can use to monitor your resources in a single view. This post focuses on deploying a CloudWatch dashboard that you can use to create a customizable monitoring solution for your AWS Network Firewall firewall. It’s designed to provide deeper insights into your firewall’s performance and security events simplifying security monitoring.
Network Firewall is a managed service that you can use to deploy essential network protections to Amazon Virtual Private Clouds (Amazon VPCs). Network Firewall provides comprehensive logs and metrics through CloudWatch, and we’re expanding its capabilities with this CloudWatch dashboard. This enhancement makes it easier to visualize, analyze, and act on the wealth of data generated by your firewall.
This open source solution streamlines network security monitoring with a user-friendly AWS CloudFormation template that quickly deploys a dedicated monitoring dashboard. This solution incorporates a suite of CloudWatch features—basic monitoring metrics, vended logs, Logs Insights queries, Contributor Insights rules, and the dashboard itself—into a centralized view. Preconfigured widgets provide instant insights into critical areas such as top talkers, protocol distributions, and alert log trends, in addition to HTTP and TLS flow analysis. A consolidated view of key metrics and logs enables faster identification of potential security threats or performance issues. With all of this relevant network firewall data in one place, your team can respond more quickly to emerging security events.
In this blog post, we provide an overview of the dashboard and a step-by-step guide to deploy it in your environment.
Solution overview
The CloudWatch dashboard can be deployed in all AWS Regions where Network Firewall is available today, including the AWS GovCloud (US) Regions and China Regions. While the dashboard comes pre-configured, you can quickly adjust queries, time ranges, and refresh intervals to help meet your specific needs. By default, the dashboard queries firewall flow and alert log events over a 3-hour period, impacting the number of log events scanned. Logs Insights and Contributor Insights widgets showcase the top 10 data points by default, but you can enhance results by modifying queries or adjusting the Top Contributors value, though this might lead to increased costs. You can configure the auto-refresh interval of the widgets to get real-time visibility and optimize costs. See the Amazon CloudWatch Pricing guide for up-to-date free and paid tier pricing considerations.
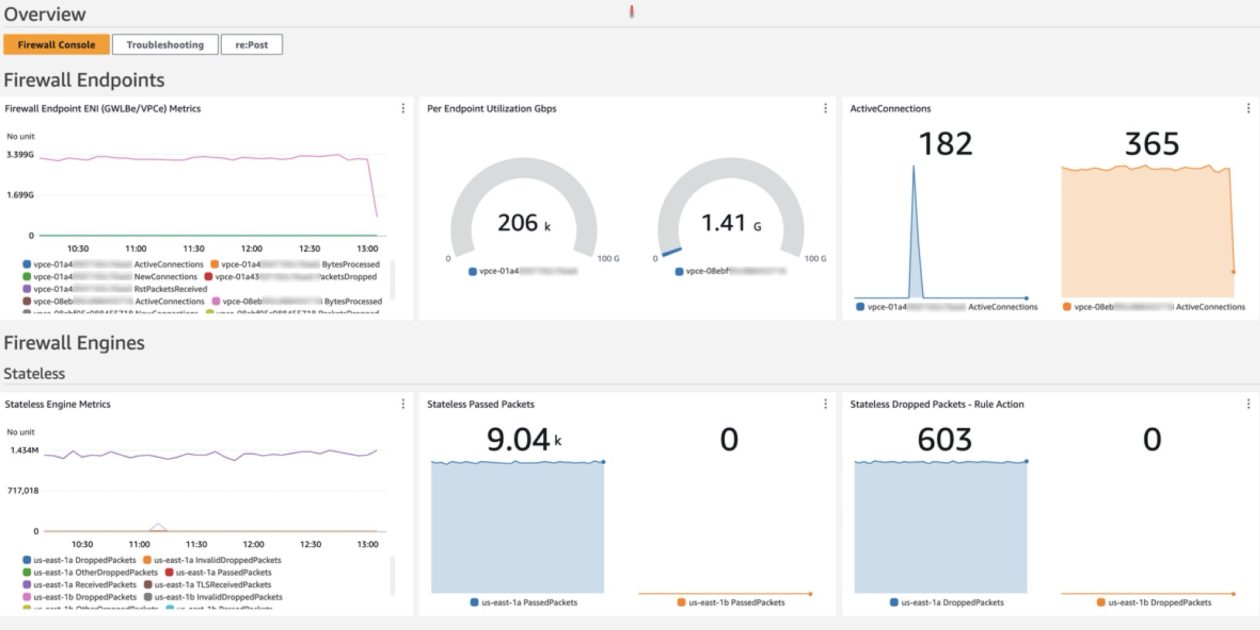
The dashboard, shown in Figure 1, can be deployed using CloudFormation and includes data and analytics from the following sources:
Native CloudWatch metrics from the AWS/NetworkFirewall and AWS/PrivateLinkEndpoints namespaces
CloudWatch Logs Insights queries that analyze Network Firewall flow and alert logs
CloudWatch Contributor Insights rules that aggregate data from Network Firewall flow and alert logs.
Figure 1: CloudWatch dashboard
Walkthrough
In the dashboard, the Logs Insights and Contributor Insights widgets display the top 10 data points by default. You can edit the Insights queries or change the Top Contributors to a larger value to display more results, as shown in Figure 2.
Figure 2: Top Talkers dashboard showing a change to the Top Contributors value
You can also manually refresh the data within a single or multiple widgets, or you can configure the entire dashboard to automatically refresh at a configured time interval as shown in Figure 3. The dashboard won’t automatically refresh the widget data by default.
Figure 3: Configuring the dashboard to automatically refresh
Prerequisites
Deploying the Network Firewall CloudWatch Dashboard is straightforward. You will need the following:
A Network Firewall in your VPC.
Your Network Firewall must be configured to publish firewall flow and alert logs to two different CloudWatch log groups. For example, firewall flow logs are published to /my-firewall-flow-logs and alert logs are published to /my-firewall-alert-logs.
If you haven’t deployed Network Firewall in your VPC, you can use one of the available AWS Network Firewall Deployment Architecture templates to create a firewall. After creating a firewall, configure CloudWatch log groups for the firewall flow and alert logs and configure stateful logging as described previously. Fine-tune your firewall policy and rule configuration and make sure that you’re routing traffic symmetrically through the firewall. With the firewall now in the routed path and publishing metrics and log events, you can proceed with this Network Firewall CloudWatch dashboard template.
Deployment
The Network Firewall dashboard CloudFormation template creates a monitoring dashboard for a single Network Firewall firewall. Make sure that you launch this CloudFormation stack in the same AWS Region and account as the firewall, regardless of whether the firewall is set up centrally or in a distributed manner.
To deploy the dashboard:
Choose Launch Stack for the relevant AWS Region. Make sure that you’re signed in to the appropriate AWS account and Region.
Region: China
Region: Gov Cloud
Region: All other regions supported by AWS Network Firewall
You will be redirected to the Create stack page in the AWS Management Console for CloudFormation. Make sure that you’re in the correct Region and using the correct template. Choose Next. The following are the Regions and their template names:
China Region: nfw-cloudwatch-dashboard-china.yaml
Gov Cloud Region: nfw-cloudwatch-dashboard-govcloud.yaml
All other Regions: nfw-cloudwatch-dashboard.yaml
Figure 4: Make sure that you’re using the correct template
When launching the stack, you will need to enter the following parameters:
Stack name: A descriptive name for this CloudFormation stack. For example, my-firewall-dashboard.
Firewall name: The firewall name as seen in the Amazon VPC console. In the Amazon VPC console, choose Network Firewall in the navigation pane, then choose Firewalls.
Firewall subnets: The firewall subnet IDs to which your firewall endpoints are attached. The firewall subnets can be found on the Firewall details tab of your firewall in the Amazon VPC
Flow log group name: The name of the CloudWatch log group where your firewall flow logs are stored.
Alert log group name: The name of the CloudWatch log group where your firewall alert logs are stored.
Contributor Insights rule state: Enable or disable the Contributor Insights rules (the template defaults to enabled). Disabling will stop the rules from scanning log data and displaying results in the Contributor Insights widgets. After the rules are created, you can change the state of one or more Contributor Insights rules from CloudWatch console by choosing Insights from the navigation pane, and then choosing Contributor Insights.
After the stack reaches CREATE_COMPLETE status, go to the Outputs tab and choose the FirewallDashboardURI link to open the new dashboard in the CloudWatch Dashboards console. It might take a few minutes for the Logs Insights and Contributor Insights widgets to start displaying data. For more details about each widget, see the README. If you don’t have log events matching the query parameters in the widgets, some widgets might not show data points.
Troubleshooting
If you encounter issues during or after deployment, review the following:
Firewall logging is enabled and configured to use CloudWatch instead of Amazon Simple Storage Service (Amazon S3) or Amazon Kinesis.
Both firewall flow and alert logging are enabled, not just one.
Log group names are entered correctly; incorrect names will cause widgets to point to invalid data.
Correct subnets are selected. Incorrect choices can impact the PrivateLink metrics widgets.
Firewall name is entered correctly. An incorrect name can disrupt metrics widgets, dashboard, and Contributor Insights widget names and break the firewall link.
Cleaning up
You can delete the Network Firewall CloudWatch dashboard and all of the associated resources with a few clicks. Deleting the dashboard will not impact the routing and network traffic inspection performed by the firewall.
Sign in to the CloudFormation console in the Region where you launched the stack and choose Stacks from the navigation pane.
Select the Stack name you chose when launching the stack. For example, my-firewall-dashboard.
Choose Delete.
Conclusion
We encourage you to see for yourself how this new dashboard can enhance your network security management. To get started with the AWS Network Firewall CloudWatch Dashboard, visit our GitHub repository for detailed instructions and the CloudFormation template. For a visual overview of the dashboard and its capabilities, check out our YouTube video.
If you have feedback about this post, submit comments in the Comments section below. If you have questions about this post, contact AWS Support.
Ajinkya Patil
Ajinkya is a Security Consultant at Amazon Professional Services, specializing in security consulting for AWS customers within the automotive industry since 2019. He has presented at AWS re:Inforce and contributed articles to the AWS Security blog and AWS Prescriptive Guidance. Beyond his professional commitments, he indulges in travel and photography.
Todd Pula
Todd is a Sr. Cloud Support Engineer at AWS and a service experience owner for AWS Network Firewall. He is an accomplished problem solver helping customers build and troubleshoot complex cloud networking and security solutions. He has a Master’s degree in Information Technology and is a Cisco Certified Internetwork Expert (CCIE).
Amish Shah
Amish is a seasoned product leader with over 15 years of experience in developing innovative and scalable solutions for networking, security, and cloud use cases. He currently leads the AWS Network Firewall service, where he helps to develop security solutions that protect AWS workloads. Outside of work, Amish enjoys playing cricket and soccer, loves to travel, and has recently picked up a hobby of collecting niche fragrances.


